Biloxx Logo Biloxx Logo
BILOXX Create New Possibilities
Resume Studio Check My AI Score
MOST IN-DEMAND COURSE

Tableau & AI Data Visualization.

Transform complex data into clear, interactive and decision-ready visual stories — with the help of AI, in just 30 days.

30 Days

Total course duration to go from basics to advanced.

100% Practical

Hands-on learning with real business dashboards.

Beginner Friendly

No prior experience needed.

Turn your data skills into powerful visual stories — starting today.

Enroll Now

What You'll Master

PRACTICAL SKILLS. REAL VISUAL IMPACT.

Tableau
Fundamentals

Learn the interface, data connection and core concepts

Data Preparation
& Cleaning

Prepare, transform and model data for analysis

Visualisations
& Charts

Create powerful charts and custom visualisations

Interactive
Dashboards

Design dynamic and insightful dashboards

AI-Powered
Analysis

Use ChatGPT & AI tools to find insights and build visuals

Data
Storytelling

Turn data into compelling stories and business insights

30-Day Learning Roadmap

A STEP-BY-STEP JOURNEY
FROM BASICS TO REAL PROJECTS.

Week 1

Tableau Foundations
  • Tableau interface & setup
  • Data connection
  • Basic charts & visualisations
  • Dimensions & measures
  • Hands-on practice

Week 2

Data Preparation & Visuals
  • Data cleaning & formatting
  • Calculated fields
  • Filters & parameters
  • Advanced visualisations
  • Dashboard design basics

Week 3

Interactive Dashboards
  • Dashboard development
  • Actions, filters & parameters
  • Data storytelling techniques
  • AI-assisted visual analysis
  • Real-world business dashboards

Week 4

Projects & Real Application
  • Build complete dashboards
  • Business case studies
  • Industry-relevant project
  • Optimisation & best practices
  • Final assessment & review

Projects You'll Build

BUILD A PORTFOLIO THAT
SHOWCASES REAL SKILLS.
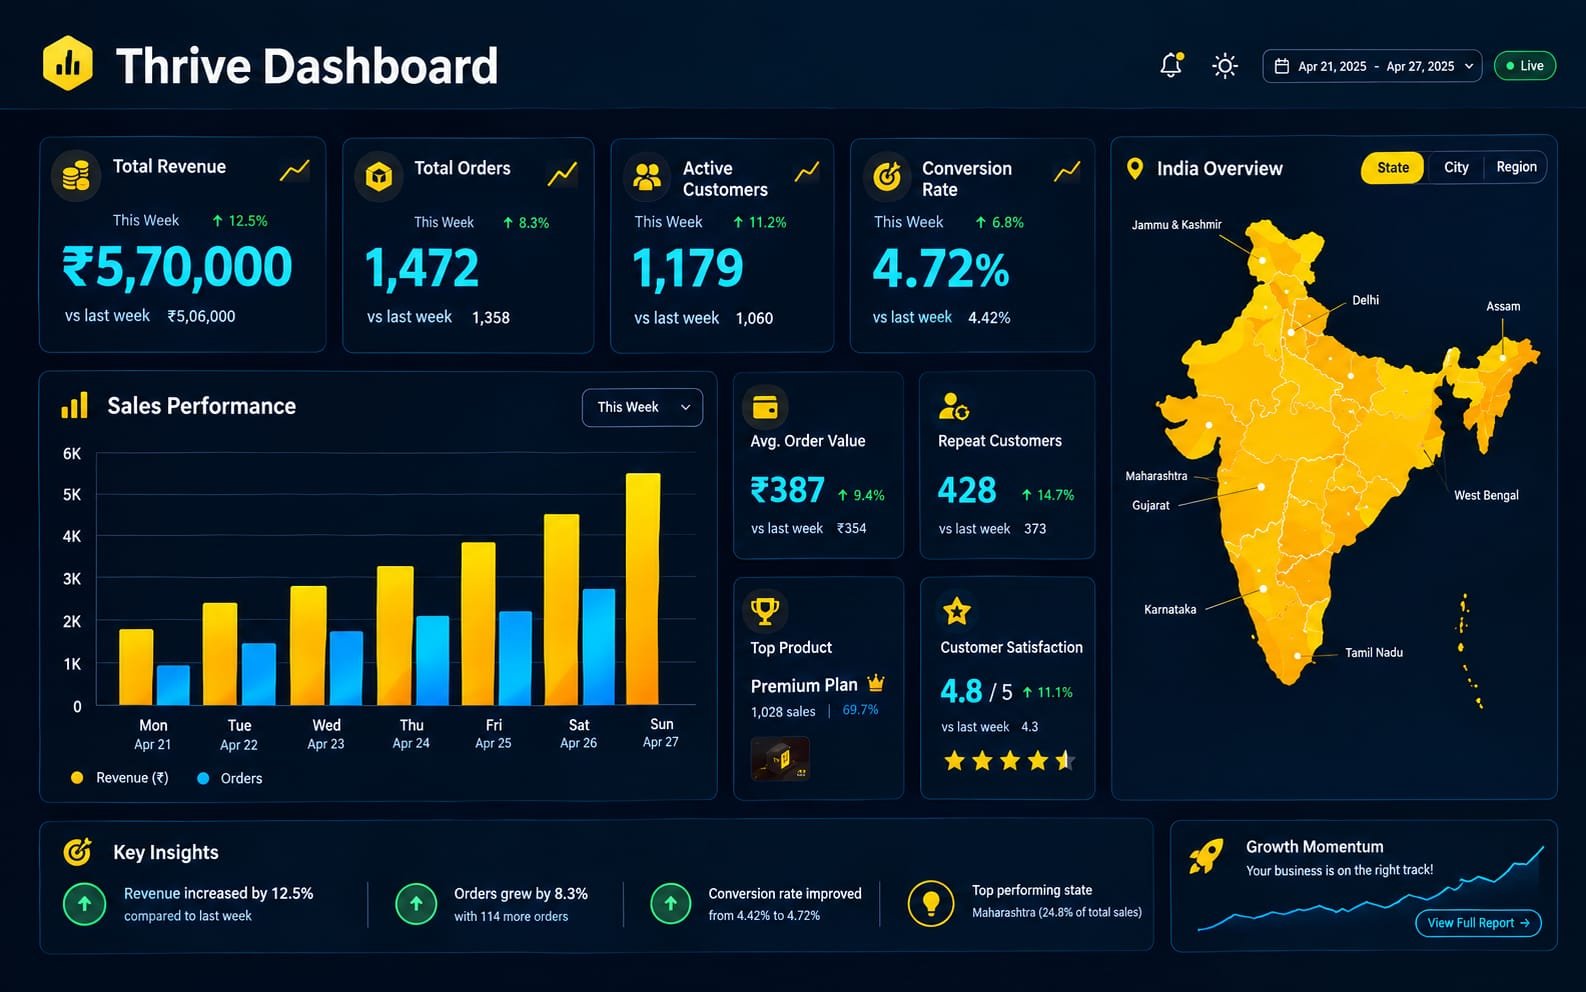
Sales Performance Dashboard preview

1. Sales Performance Dashboard

Create an interactive dashboard to analyse sales, revenue, products, regions and growth trends.
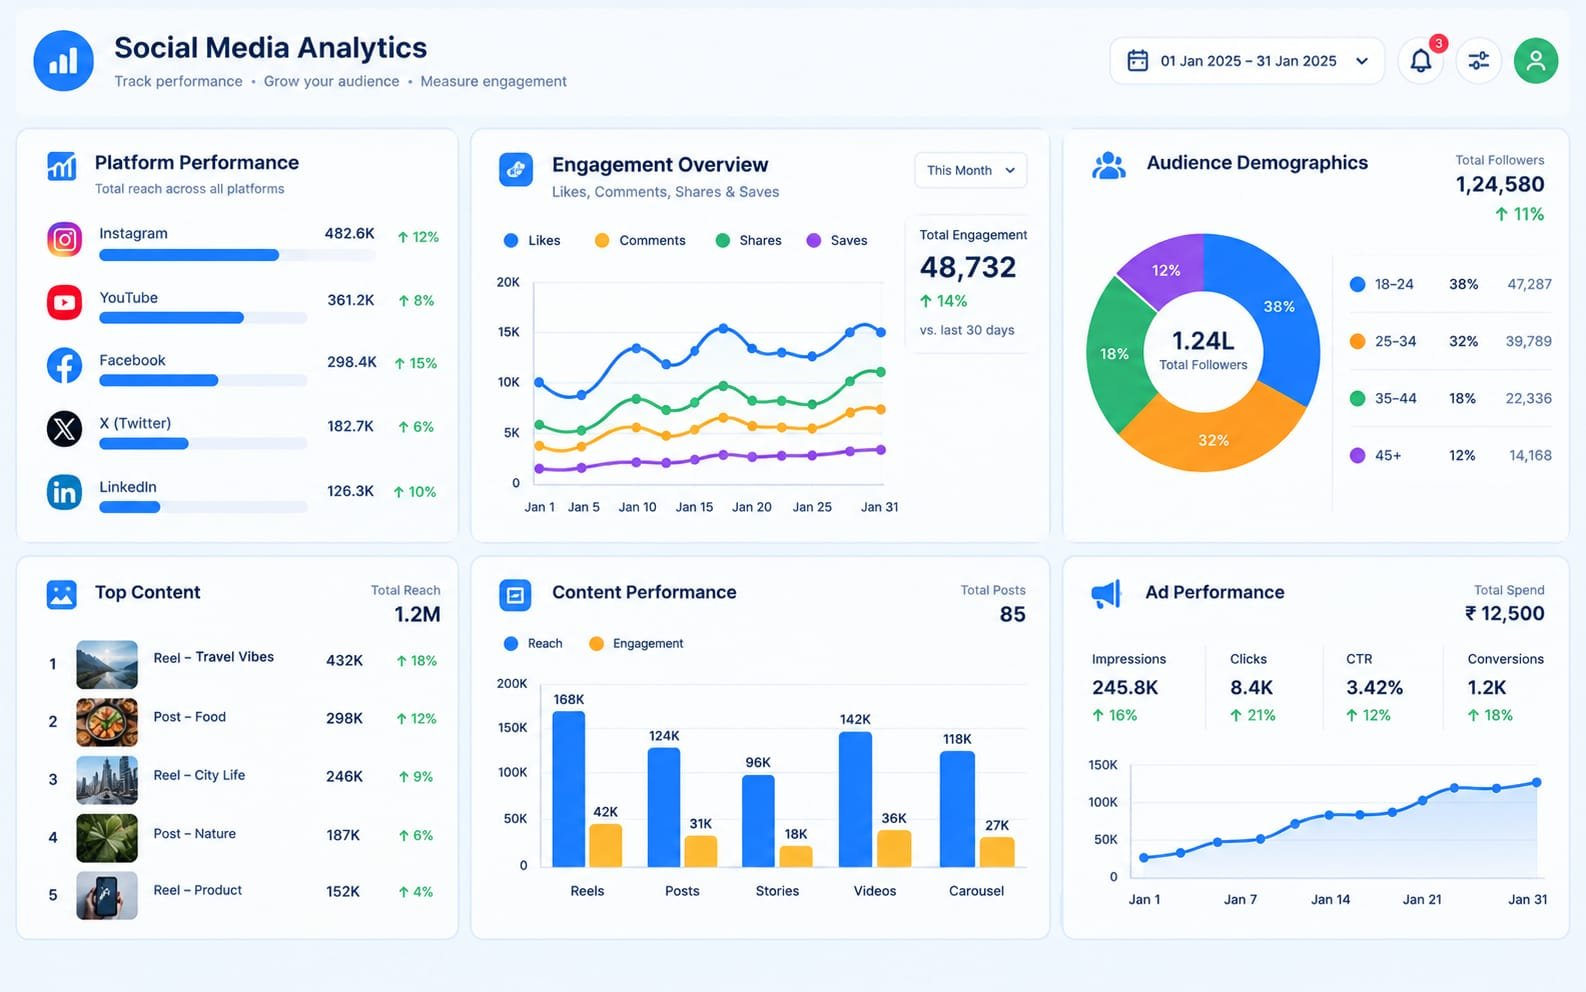
Customer Analytics Dashboard preview

2. Customer Analytics Dashboard

Build a complete customer analytics dashboard with segmentation, behaviour and key insights.

What's Included

30-Day

Structured Curriculum

Hands-on

Practical Assignments

Real-World

Business Datasets

AI Tools &

Visualisation Training

Project Portfolio

(3+ Projects)

Mentor Support

& Doubt Clearing

Certificate

of Completion

Lifetime Access

to Learning Material

Who Is This For?

SUITABLE FOR LEARNERS AT ANY STAGE.

Students

Build in-demand skills

Freshers

Start your data career

Working Professionals

Upgrade your analytical skills

Business Analysts

Create better reports

Managers & Leaders

Make data-driven decisions

Anyone Interested

Learn data visualisation

What You'll Get After Completion

MORE THAN JUST A COURSE.
REAL CAREER VALUE.

Completion
Certificate

3 Real-World
Projects

Portfolio-Ready
Tableau Work Samples

Resume & LinkedIn
Ready Points

Practical Tableau + AI Skills
for Job or Business

Tools You'll Work With

INDUSTRY-RELEVANT TOOLS.
USED IN REAL BUSINESS SCENARIOS.
Tableau
Excel
SQL
Google Sheets
ChatGPT
Copilot
Google Analytics
Power BI
AI Tools

Course Fee

₹X,XXX

One-Time Payment • Lifetime Access
Enroll Now
Secure Payment
Instant Access

Special Launch Benefits

  • Lifetime access to all future updates
  • Practice files and datasets included
  • Certificate of completion
  • Doubt support from mentors
  • Real-world project portfolio
LIMITED
TIME OFFER

Frequently Asked Questions

STILL HAVE QUESTIONS?
WE'VE GOT YOU COVERED.
Not at all. This course starts from the basics — Tableau interface, data connection and core concepts — before moving into dashboards and AI-assisted analysis, so complete beginners can follow along comfortably.
Unlike scattered free videos, this is a structured 30-day roadmap with real business datasets, hands-on dashboard projects, AI-integration training, mentor support and a certificate — everything organised in one place instead of you piecing it together yourself.
Yes. On completing the course and final assessment, you'll receive a Certificate of Completion that you can add to your resume and LinkedIn profile.
Absolutely. The 30-day structure is just the learning path — once enrolled, you get lifetime access to all course material, including any future updates, so you can revisit it anytime.
Yes, dedicated mentor support is included throughout the course. Whenever you're stuck on a dashboard, chart or concept, you can reach out and get your doubts cleared.
You just need Tableau (Public or Desktop) installed on your computer and access to an AI tool such as ChatGPT. Everything else — datasets, templates and resources — is provided as part of the course.
Tableau and AI-driven data visualisation skills are in high demand across almost every industry. By the end of the course you'll have a portfolio of real dashboards and practical skills that can strengthen your resume for new roles or a promotion.
Please refer to our refund policy page for full details and eligibility conditions. Reach out to our support team within the specified window if you'd like to request a refund.

Turn Data into Opportunities with Tableau & AI.

Join thousands of learners who are using data visualisation to grow their careers and businesses.

Enroll Now